Load Metrics
To load previous results into your model, you right-click on the Metrics button. The Choose and Load Metrics boxes are displayed. The Load Metrics box is also displayed when any of the node-based metrics are finished running. The boxes provide options for how the results are displayed, and depend on which metric you are loading.
Right-click on metrics to load existing simulation results
Lighting Test prompts you to choose which metric to load. Most of these are self-explanatory; however, ‘Illuminance from DA’ is a new feature which allows visualization of the hourly illuminance results from Daysim / Climate-based metrics.
Choose Select Metric to Load if loading a grid-based result.
Choosing Climate-Based Falsecolor will allow an hourly temporal map of climate-based simulation results for a selected point.
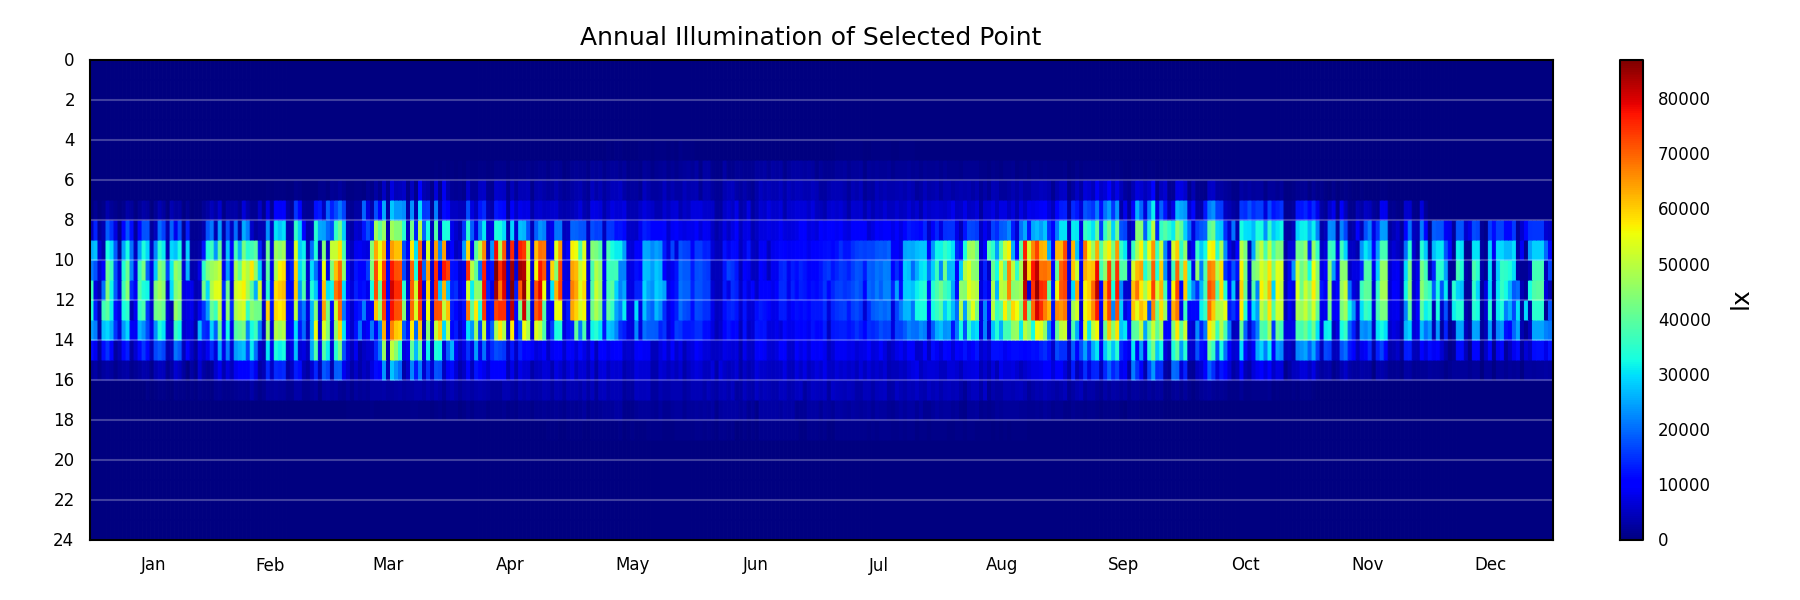
A result of the climate-based falsecolor option
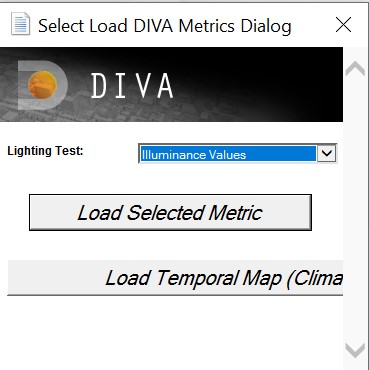
Load metrics dialog
Min/Max Illuminance
- (Illuminance and Continuous Daylight Autonomy)
- The user can set the lower and upper bounds which correspond to the colors displayed on the false-color node grid.
Min/Max Irradiance
- (Radiation Nodes)
- The user can set the lower and upper bounds which correspond to the colors displayed on the false-color node grid.
Min/Max Daylight Factor
- (Daylight Factor)
- The user can set the lower and upper bounds which correspond to the colors displayed on the false-color node grid.
Color Scheme
- (All Metrics)
- This option lets the user select which color scheme to use for the false-color node grid.
Label 1% Peak Nodes
- (All Metrics)
- By checking this box, the 1% peak nodes will be highlighted.
Label All Nodes
- (All Metrics)
- Checking this box will display the numeric result value at each node. These node labels are stored on their own DIVA sublayer called, “Node Values”.
Color Extreme Values
- (Daylight Factor, Illuminance, Radiation Nodes, Continuous Daylight Autonomy)
- Panels whose values fall below the set range are shaded black and those that fall above are shaded bright pink.
Display Footcandles
- (Illuminance, Continuous Daylight Autonomy, Useful Daylight Illuminance, Daylight Autonomy, Daylight Availability)
- This should be checked if the user selected “footcandles” as the “Lighting Units” in the Metrics dialog box before running the metric.
Create Variant Label
- (All Metrics)
- In this space the user can enter a “variant” label (or title) for the calculation. This helps in remembering key options that were being tested during the metric.